

Why in news?
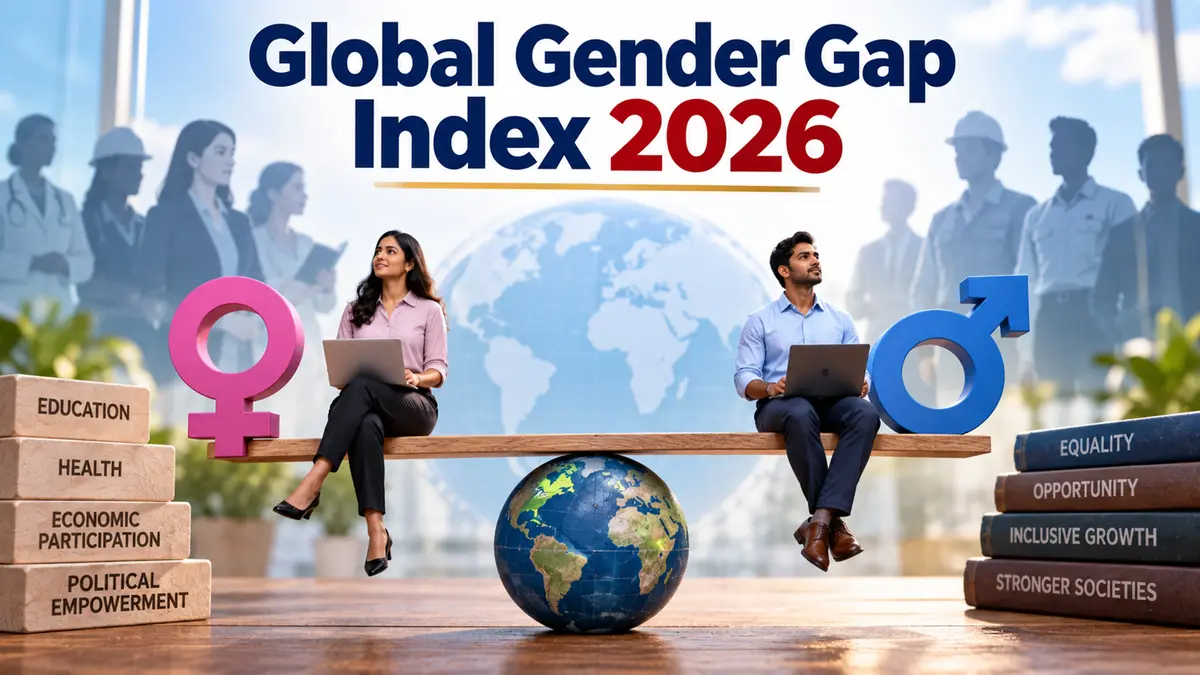
The World Economic Forum (WEF) released its Global Gender Gap Report on 16 September 2026, placing India 131st among 145 economies. India's position was unchanged, although its overall score rose slightly to 64.5% parity. Iceland remained first, followed by Finland and Norway. The index compares gaps between women and men in education, health, economic participation and political power. It therefore asks a different question from a national income ranking: how evenly are opportunities and outcomes shared? India's result shows comparatively narrow education and health gaps alongside much wider economic and political gaps. That pattern is more informative than the rank alone.
What a gender-gap score means
First published in 2006, the index measures relative differences rather than the absolute prosperity of women. A wealthy country can leave large gaps between women and men. A poorer country can perform better on particular parity measures despite lower overall living standards. The index is consequently useful for comparing distribution, but it cannot replace separate measures of poverty, service quality or personal safety.
Scores generally run from zero to one, with one representing the parity benchmark. Expressed as a percentage, India's 0.645 becomes 64.5%. This does not mean that 64.5% of Indian women have equal rights, jobs or political representation. It is a composite score built from selected indicators. Likewise, a higher ranking does not prove that every woman in that country experiences equality.
Four different dimensions of opportunity
Economic Participation and Opportunity covers labour-force participation, earnings and representation in professional and leadership roles. Educational Attainment compares literacy and enrolment across education levels. Health and Survival uses the sex ratio at birth and healthy life expectancy. Political Empowerment measures representation in Parliament and ministerial positions, together with years of female leadership over a rolling 50-year period.
The four dimensions receive equal weight in the overall index. Within them, individual indicators are combined using the report's methodology. Female-to-male ratios are normally capped at the parity benchmark, so an advantage in one measure cannot endlessly offset disadvantage elsewhere. Health indicators have specific benchmark adjustments. This construction makes the index a defined measurement framework, not a complete inventory of every gender-related experience.
Reading India's result beyond 131st place
India's economic parity score is 41.2%, compared with 96.6% in education and 95.6% in health. Political parity stands at 24.5%. The contrast helps explain why near-parity in enrolment cannot be treated as proof of equal career outcomes. Entering education and gaining access to paid work, senior positions or public office are related but distinct stages of opportunity.
The economic score increased by 0.5 percentage points from the previous edition. Education moved in the other direction, declining by 0.5 percentage points. Health improved, while political empowerment remained India's highest-ranked dimension at 67th globally. That last comparison concerns relative rank. A better political rank can coexist with closing only about a quarter of the measured political gap.
Changes in the political index also need historical context. Its leadership indicator looks back over 50 years. As older years leave that window, the score can change even without a new election or appointment. Similarly, a representation parity ratio is not the same as women's percentage of seats. Keeping those measures separate prevents a ranking story from producing misleading claims about today's Parliament or Cabinet.
The global picture and its limits
The report places global parity at 69.2%. Iceland scores 93%, and remains the only economy above 90% in this edition. Namibia ranks fourth, illustrating that high performance is not confined to Europe's richest economies. Across the world, education and health are closer to parity than economic participation and political power. The broad challenge is turning access into influence and durable opportunity.
WEF estimates that full parity remains about 120 years away at the historical rate of progress. This is a conditional projection, not a forecasted completion date. Policy changes, economic shocks or reversals could alter the path. The report also tracks a constant group of economies across editions, because changes in country coverage can complicate comparisons of headline averages over time.
What the index can help explain
The report distinguishes increasing participation from gaining influence. Its wider analysis examines leadership, career interruptions and access to emerging economic opportunities. These issues help explain why education gains need not automatically produce comparable workplace gains. However, the index alone cannot identify the cause of every gap. Understanding particular barriers requires more detailed evidence on sectors, regions, households and the implementation of policies.
Underlying observations also come from different reference years. A report published in 2026 is not a survey of every indicator conducted that September. The score should guide questions about where progress is uneven, rather than serve as a verdict on one recent measure. For India, the economic and political gaps particularly merit attention alongside continued improvement in education and health outcomes.
Conclusion
India's unchanged rank conceals small movements in different directions across the index. The useful lesson is not simply that the country stands 131st. It is that educational access, economic opportunity and decision-making power have advanced unevenly. Reading the score, its components and their reference periods together gives a clearer account of progress. It also reveals gaps that a single ranking cannot explain.