

Why in news?
Research on the Nilgiri Biosphere Reserve has drawn attention to climate-driven changes in forest seasonality. Scientists analysed satellite vegetation data from 2001 to 2020 across four forest types. They found that the timing and length of active growth changed between the two studied decades. Long-term records also showed gradual warming and declining average rainfall, although responses differed between forests.
What forest phenology means
Phenology studies the timing of recurring biological events. In forests, it includes leaf emergence, flowering, fruiting and leaf fall. Satellite data can estimate the start and end of the green growing season. The period between them is called the length of season.
Seasonal timing links plants with pollinators, seed dispersers and herbivores. A shift in leaves can change food available to insects. That effect can reach birds and mammals. Rivers and soil processes also respond to changing canopy activity.
How the study worked
The researchers used the Moderate Resolution Imaging Spectroradiometer Enhanced Vegetation Index. The satellite product provided observations every sixteen days. They compared 2001–2010 with 2011–2020. The analysis covered moist deciduous, dry deciduous, semi-evergreen and wet evergreen forests.
They also examined India Meteorological Department climate records from 1950 to 2018. Annual mean temperature rose by about 0.01 degrees Celsius each year. Annual mean precipitation declined by about 3.97 millimetres each year. These are long-term statistical trends, not identical changes at every site.
What the results showed
The start of season generally became later during the first decade. It advanced during the second decade across the studied forest types. End-of-season behaviour varied more. Deciduous and evergreen forests did not always respond in the same direction.
The overall record showed a compressed season in important periods. Rising temperature and irregular rainfall offered a plausible climatic explanation. The authors stressed that changes were not uniform. Shorter time segments revealed details that a single twenty-year average could hide.
Why different forests respond differently
Deciduous trees lose leaves during dry conditions and often respond sharply to rain. Evergreen forests maintain foliage for longer but still change canopy activity. Elevation alters temperature and cloud exposure. Soil depth and slope also control how long plants retain water.
A common climate trend can therefore produce different local outcomes. Species within one forest may also respond separately. Satellite greenness measures the canopy as a whole. Ground observations remain necessary to identify individual species and ecological mechanisms.
Geography of the reserve
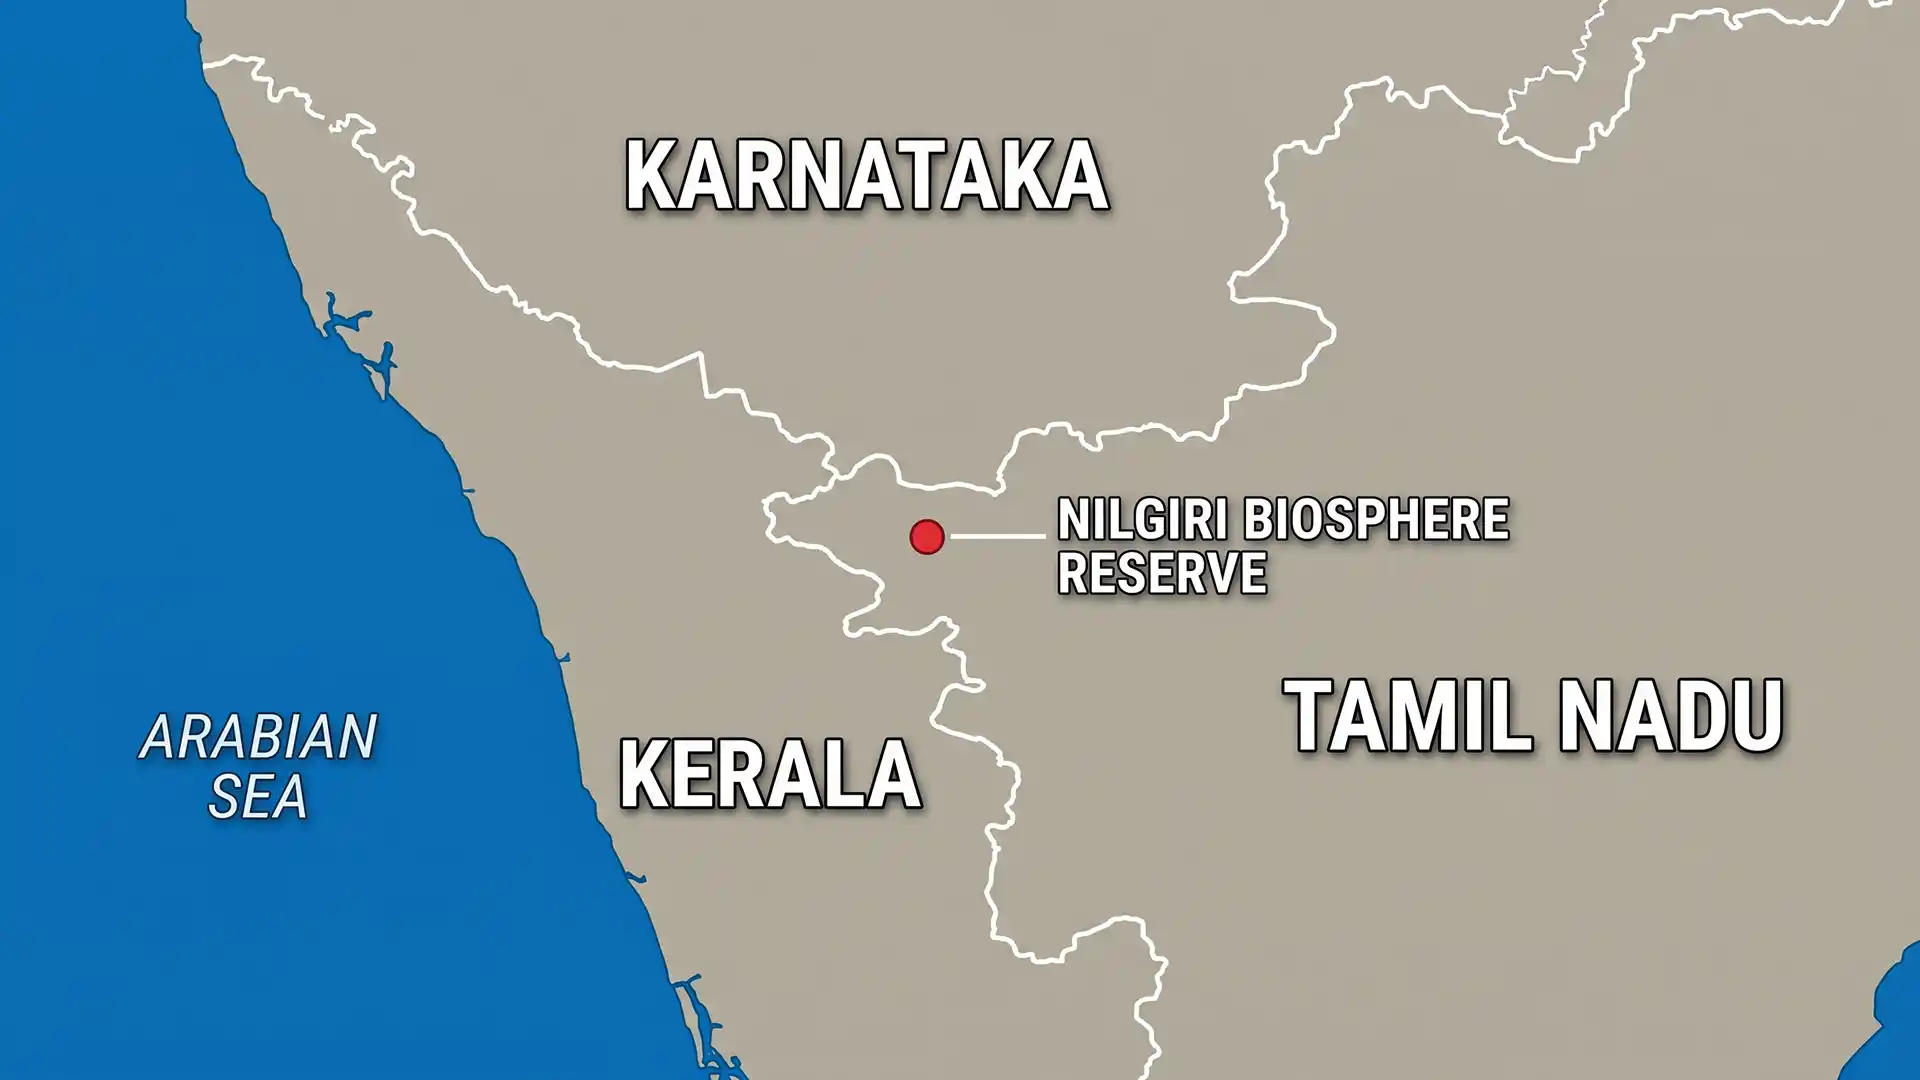
The Nilgiri Biosphere Reserve covers 5,520 square kilometres across Tamil Nadu, Kerala and Karnataka. India established it in 1986 as the country’s first biosphere reserve. The United Nations Educational, Scientific and Cultural Organization added it to the World Network in 2000.
The reserve occupies the Western Ghats around the Nilgiri massif. Elevation ranges from about 300 to 2,670 metres. Habitats include lowland dry forest, moist deciduous forest, evergreen forest and high montane shola–grassland. Several protected areas form one connected conservation landscape.
Why this location is ecologically important
The landscape sits where tropical forest types meet strong elevation gradients. It supports many endemic plants and animals. Forests also connect elephant and tiger habitats across three states. Headwater streams support people and farms far beyond the protected boundaries.
Climate pressure interacts with roads, plantations, tourism and invasive plants. A disturbed forest may recover less easily from drought or fire. Connectivity allows species to move as conditions change. Fragmentation blocks that response and concentrates human–wildlife conflict.
Implications for management
Managers need permanent field plots across elevation and forest type. Satellite signals should be checked against flowering, fruiting and leaf records. Water and fire data can identify emerging thresholds. Local and Indigenous knowledge can add longer seasonal memory.
Restoration should use native species suited to future conditions. Protecting shola–grassland mosaics is especially important at high elevation. Fire planning must avoid treating every ecosystem alike. Coordination between three state governments is essential because wildlife and watersheds cross administrative borders.
Limits of the evidence
The study describes association rather than a single proven cause for every change. Satellite pixels combine several species and canopy layers. Rain gauges may not capture all mountain variation. The period also includes natural climate cycles and local disturbance.
These limits do not make the signal meaningless. They show where ground research should improve explanation. Longer records can test whether shifts continue. Management should use the evidence cautiously while preparing for greater heat and rainfall uncertainty.
“Destabilising” does not mean immediate forest collapse
The evidence shows altered seasonal timing and climatic pressure. It does not prove that every forest patch is failing. Risk grows when repeated shifts disrupt species relationships, water balance and recovery.
Conclusion
The Nilgiri study shows that climate change can alter when forests function, not only where they survive. Different forest types respond through their own water and temperature relationships. Management needs finer local monitoring and stronger landscape connectivity. Reducing non-climate pressures can improve resilience. The reserve’s tri-state geography makes coordinated science and governance especially urgent.