

Why in news?
Uttar Pradesh filed an additional response about the Solani floodplain before the National Green Tribunal on 7 September 2026. The filing addresses contour mapping and a 100-year flood standard. It also reports earlier notification and boundary-pillar work. These are statements in the state’s response, not a new judicial declaration that every compliance issue is settled.
Following the river’s actual course
The state’s filing places the Solani’s origin in the Himalayan foothills near Dehradun, Uttarakhand. It then flows into Uttar Pradesh through Saharanpur and Muzaffarnagar districts. The report identifies its outfall into the Banganga upstream of Shukratal. It should not be described as flowing through Bijnor, which the filing expressly excludes.
The Solani belongs to the wider Ganga drainage system. Naming that basin is useful, but does not replace the immediate river connection. “A river in the Ganga basin” and “a river joining the Ganga directly” are different geographical statements. Here, the filed account identifies the Banganga as the immediate receiving river.
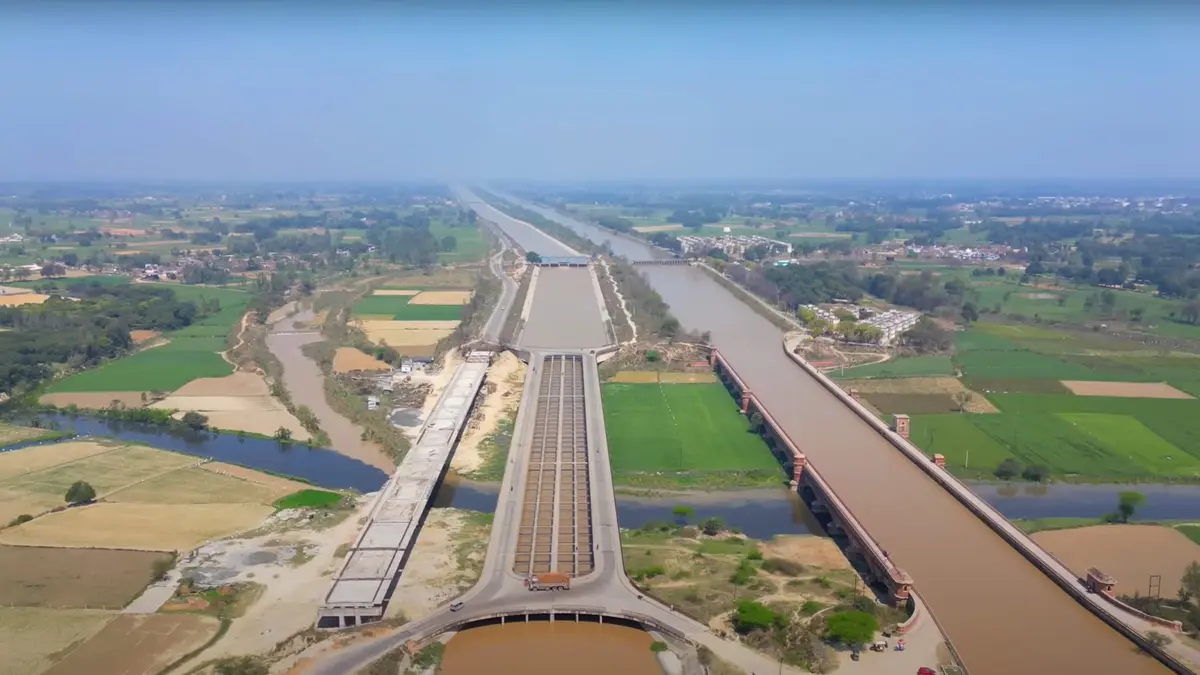
Roorkee, in Uttarakhand’s Haridwar district, provides another important point on the Solani landscape. The Upper Ganga Canal crosses the river through the Solani Aqueduct. Canal water is carried over the riverbed in this structure. The canal and the natural river therefore cross without becoming the same watercourse.
The engineering connection at Roorkee
The National Programme on Technology Enhanced Learning describes the aqueduct within the Upper Ganga Canal’s engineering history. Excavation of the canal began in 1842, and water entered it in 1854. The crossing illustrates the engineering challenge of carrying irrigation water across existing natural drainage. The structure preserves the separation between canal flow and river flow.
An aqueduct is not simply another name for a dam. Its purpose here is to convey one watercourse across an obstacle. That distinction helps explain the landscape around Roorkee. The managed irrigation network and the river’s flood behaviour must be understood together, even though they perform different functions.
What the tribunal wanted clarified
The response concerns Original Application 632 of 2022, brought by V.K. Tyagi. It quotes a tribunal order dated 8 July 2026. That order sought additional information on floodplain demarcation using one-metre contour intervals and a 100-year return-period flood. The issue was whether the submitted maps adequately demonstrated the required work.
The state says a physical survey and hybrid Digital Elevation Model, or DEM, were used for the relevant river reach. A DEM represents ground elevations in digital form. Contour lines connect points at equal elevation. A one-metre contour interval means successive contour lines represent elevations one metre apart.
Neither term means that floodwater is necessarily one metre deep. Grid spacing, elevation accuracy, contour interval and flood depth describe different quantities. Mixing them can make a technical report sound more precise than it is. The map must first represent the ground before modelling can estimate where water might spread.
A 100-year flood is a probability, not a timetable
A 100-year flood has a one per cent annual probability of being equalled or exceeded at a particular location. It does not occur neatly once every century. Two such floods can happen in consecutive years. The familiar label describes a statistical estimate based on the available record, not a schedule.
Assume the annual probability remains one per cent. Over 30 years, the chance of at least one exceedance is about 26 per cent. The United States Geological Survey uses this example to explain cumulative exposure. A low annual probability can matter greatly over the life of a house, road or industrial facility.
Estimates can change as longer records become available or catchment conditions change. Flood maps therefore need a clear reference date and stated assumptions. They are tools for managing risk, not guarantees that water will remain inside a permanent line. Events larger than the chosen design flood remain possible.
From a model to a usable boundary
Flood mapping connects several steps. Flow estimates describe the amount of water. Hydraulic modelling translates that flow into water levels along a river. Those levels are compared with the surrounding terrain to estimate inundation. Errors in any stage can affect the boundary finally drawn on a map.
The state reports floodplain notifications dated 24 and 27 December 2024 for the two Uttar Pradesh districts. It also reports completion of boundary pillars on 7 February 2025. Those earlier dates must remain visible. The September 2026 filing is an update about that work, not evidence that the pillars were newly installed this week.
Physical markers can help connect a technical map with land administration. Their value depends on accurate placement, maintenance and accessible records. A marker by itself does not explain permitted land uses or resolve an individual boundary dispute. Those questions require the relevant notification, mapped parcel information and applicable legal process.
The practical implication is that technical and administrative evidence must agree. Updated maps, identifiable boundary points and clear public communication should describe the same floodplain. That makes scrutiny possible for residents and authorities. It also helps distinguish a reported compliance action from a verified, continuing system of flood-risk management.
Conclusion
The Solani case shows why river geography and flood terminology belong in the same account. The state has supplied further evidence of mapping, notification and demarcation. Careful reading preserves the dates and the status of that evidence. Effective protection depends on maintaining the connection between scientific estimates, legal boundaries and conditions on the ground.