

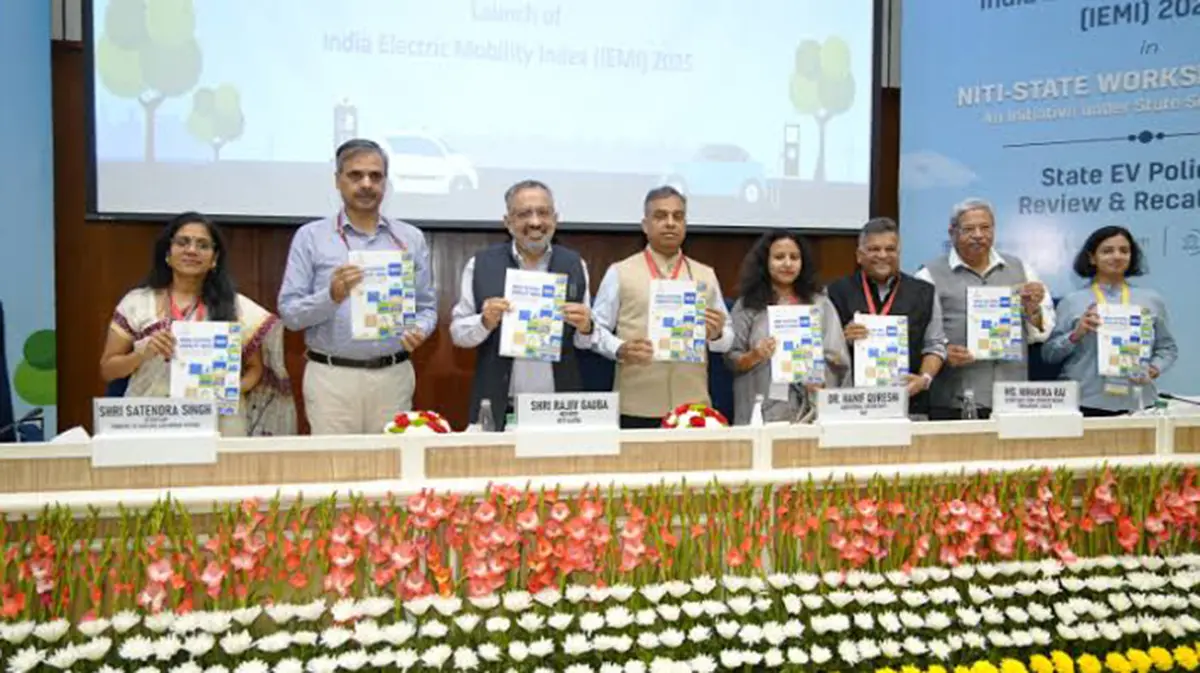
Why in news?
The National Institution for Transforming India, known as NITI Aayog, has published the India Electric Mobility Index 2025. Prepared with the World Resources Institute India, it compares all 36 States and Union Territories across adoption, charging readiness and innovation. Delhi leads the overall scores, followed by Maharashtra and Karnataka. The index matters because electric transport depends on more than a purchase subsidy: vehicles, charging access and supporting institutions must develop together. Its results describe performance during 2025, although the report was published in September 2026. A high score is a composite assessment, not the percentage of all vehicles that are electric.
What the index tries to measure
The India Electric Mobility Index, abbreviated as IEMI, is intended to compare progress while helping governments identify weaknesses. It combines 16 indicators into an overall score on a scale up to 100. Some indicators concern observed outcomes, while others concern enabling conditions. This is why a jurisdiction’s score cannot be understood by examining new vehicle registrations alone.
Electric vehicles, or EVs, need an ecosystem that allows people and businesses to use them dependably. A buyer may find a vehicle attractive but lack convenient charging. A fleet operator may need a power connection suitable for several vehicles at once. The index brings different aspects of that transition into one framework, while its separate themes show where the overall score comes from.
Three themes, with different weights
Transport electrification carries half the total weight. Charging infrastructure readiness accounts for 30 per cent, while research and innovation account for 20 per cent. These weights describe the index’s construction, not shares of public expenditure. They also mean that equal improvements in two different themes need not produce equal changes in the overall score.
The first theme examines adoption and the conditions supporting it. Charging readiness looks at infrastructure and measures that enable its development. The innovation theme considers activity such as relevant start-ups and patents. Bringing them together recognises that immediate uptake and longer-term technical capability are related but different dimensions of the transition.
What the results show
Delhi scores 84, followed by Maharashtra at 78, Karnataka at 73, Chandigarh at 71 and Goa at 65. The national spread runs from 10 to 84, with a median of 40. These numbers show substantial variation, but Delhi’s 84 does not mean that 84 per cent of its vehicle fleet is electric. It is the result of combining the index’s indicators.
The separate themes reveal differences that an overall rank can conceal. Karnataka leads charging readiness, while Delhi leads research and innovation. Only Delhi, Chandigarh and Maharashtra qualify for the top-performer category in the transport-electrification theme. Thus, the list of strongest overall performers is not identical to the list leading actual electrification progress.
How to read comparisons fairly
The report also groups jurisdictions to allow more meaningful comparisons, including large States, city States and Union Territories, and hilly or northeastern States. Geography and settlement patterns affect the task of providing charging access. Comparing only raw totals would favour larger markets, while comparing only an overall rank could hide the challenges of dispersed settlements.
Movement from one edition to another also needs care. Madhya Pradesh’s overall rank rises from twenty-third to seventh, but the report notes changes in methodology. A ranking can change because performance improves, other jurisdictions move or the measurement framework changes. It should not automatically be treated as proof that one particular policy caused the entire improvement.
From a score to a usable charging network
The International Energy Agency’s charging guidance emphasises local travel patterns, housing, grid capacity and vehicle use. A household with private parking faces a different problem from someone relying entirely on public charging. A bus depot has different needs from a roadside car charger. Planning therefore needs to begin with the users and vehicles the infrastructure is meant to serve.
A charger count alone does not tell a driver whether a charger is working, accessible or compatible with the vehicle. Nor does it show how long a user must wait. These are practical service questions that need operational information. An index of readiness is useful, but it should lead to checks on real access rather than being treated as a substitute for them.
Charging also connects transport planning with electricity planning. The Agency’s grid-integration guidance stresses coordination between institutions, assessment of additional demand and appropriate operating arrangements. Where charging times are flexible, managing when vehicles draw power can help the electricity system. A transport department and a power utility therefore need a shared implementation plan, not merely separate targets.
Conclusion
The IEMI provides a structured way to see where India’s electric-mobility transition is progressing and where it remains uneven. Its greatest value lies in the underlying indicators rather than the headline ranking. Governments can use them to identify a specific obstacle, then test whether corrective action improves everyday use. The result to pursue is dependable electric transport, not a score alone.