

Why in news?
A basin-scale study identified 219 hanging glaciers in Uttarakhand’s Alaknanda basin. Researchers mapped their form and estimated the ice held on steep slopes. They also modelled possible avalanche paths in a selected area. The results highlight exposure around Badrinath, Mana and other mountain settlements.
What is a hanging glacier?
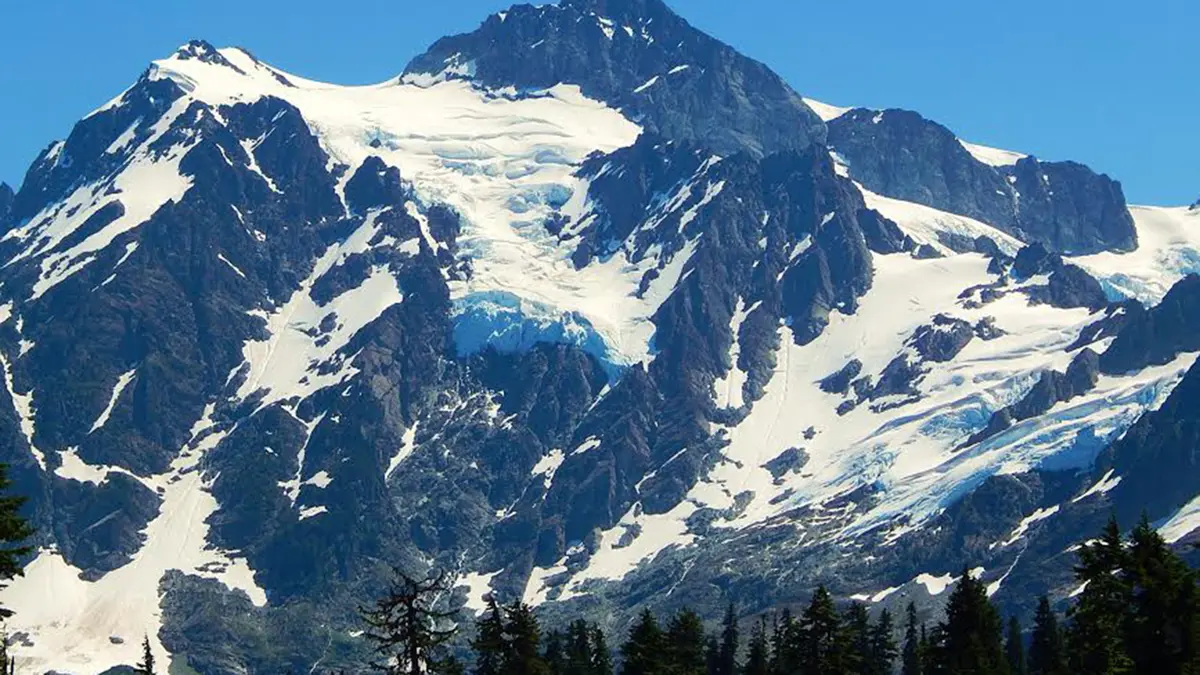
A hanging glacier occupies a steep mountainside above a main valley. Its lower ice may end at a cliff or sharp slope break. Gravity and crevassing can release snow or ice. The falling mass may become an avalanche.
Some hanging glaciers remain after a larger valley glacier thins. A tributary glacier then sits above the lower trunk surface. Others develop according to local bedrock shape and snow supply. A hanging valley is the landform left after ice retreats.
Not every hanging glacier is about to collapse. Stability depends on slope, temperature, fractures and bed conditions. Avalanches may fall onto another glacier without reaching people. Hazard and exposure must therefore be assessed separately.
The Alaknanda setting
The Alaknanda basin lies in Uttarakhand’s Garhwal Himalaya. It covers roughly 11,055 square kilometres. The river begins around the Satopanth and Bhagirath Kharak glaciers. It meets the Bhagirathi at Devprayag to form the Ganga.
The basin includes the Mandakini, Pindar, Nandakini and several upper tributaries. Its elevation rises from deep valleys to peaks above 7,000 metres. Badrinath, Mana, Joshimath and Chamoli occupy important routes. Pilgrimage, tourism, roads and hydropower increase human exposure.
Steep relief allows a falling mass to gain speed rapidly. Narrow valleys can channel ice, rock and water downstream. A first slope failure may therefore create several connected hazards. This makes the basin an important site for integrated risk research.
What the inventory found
The 219 mapped glaciers cover 71.7 square kilometres, with stated uncertainty. Researchers estimated 2.39 cubic kilometres of total ice. About 0.74 cubic kilometres was classed as hanging mass. The average surface slope was close to 34 degrees.
The Upper Alaknanda held roughly thirty per cent of hanging-mass volume. Researchers classified glaciers by bed shape and fracture pattern. Ramp-slab and terrace-slab forms dominated the inventory. Only three fell into the terrace-wedge category.
Satellite images from 2020 to 2023 supported manual mapping. The team used elevation models and existing glacier inventories. Manual checks helped identify small features on steep terrain. Even so, remote sensing cannot reveal every internal weakness.
What the simulations show
The team modelled twenty-five glaciers in a sample area. It assumed complete failure of the identified hanging mass. This is a severe scenario, not a forecast. The purpose was to locate elements that could be exposed.
Simulated flow heights reached about 51 metres at Badrinath. The Badrinath–Mana road showed heights near 48 metres in the model. Hanuman Chatti and Ghangharia also entered some runout zones. Actual outcomes would depend on release volume and material behaviour.
Projected exposed built-up area rose from about 8,000 square metres in 2000. It reached nearly 152,000 square metres for the 2030 scenario. Modelled exposed population rose from about 380 to 8,500. These numbers combine simulation with settlement projections.
Lessons from the 2021 Chamoli disaster
On 7 February 2021, rock and glacier ice collapsed from Ronti Peak. The mass moved through Ronti Gad, Rishiganga and Dhauliganga valleys. It transformed into a highly mobile debris flow. Two hydropower projects suffered severe damage.
Satellite analysis estimated a release near 27 million cubic metres. More than two hundred people died or remained missing. The event demonstrated a cascading mountain hazard. It was not a conventional glacial-lake outburst flood.
The new inventory includes glaciers in the wider affected region. It does not predict another event at a specific time. Its main contribution is a systematic baseline. That baseline can guide monitoring and land-use decisions.
How risk can be reduced
Monitoring should combine optical images, radar and ground instruments. Repeat observations can detect widening cracks or faster motion. Weather and temperature records add context. Automated alerts still need expert interpretation.
Hazard maps should guide roads, hotels and public facilities. New construction should avoid modelled flow paths where practical. Existing settlements need marked safe areas and evacuation drills. Seasonal visitor numbers must be included in planning.
Critical infrastructure requires multi-hazard design. A bridge may face debris, water and impact from large blocks. Hydropower planning should examine the entire upstream catchment. Emergency communication must continue after power or road failure.
Local knowledge can improve official maps. Residents observe new cracks, sounds and water changes. Reporting channels should be simple and trusted. Communities also need honest explanations of uncertainty.
Exposure figures are modelled scenarios
The study did not predict that every mapped glacier will fail. Its simulations show where severe releases could travel under stated assumptions.
Conclusion
The inventory fills an important gap in Himalayan glacier knowledge. It separates widespread hanging ice from sites of direct human exposure. Development is moving closer to some possible avalanche paths. Monitoring must therefore be joined with careful land-use planning. The strongest warning is practical preparedness, not unsupported alarm.